Tutorial
This tutorial will step by step show you how to produce vehicular traces and run them with a microscopic traffic simulator SUMO. Therefore, we will use all input files in XML format defined for SUMO.
1. Download OSM files from Open Street Map
You can go to OSM web site and manually download the area of your interest. We want to download a large area of Luxembourg country as shown on the picture:
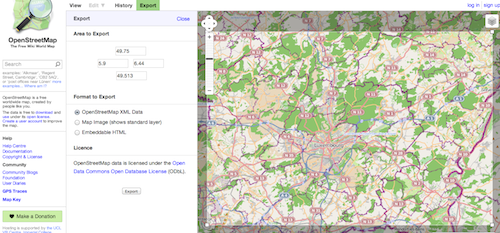
However, OSM restricts the size of downloaded data by a single request. It means that to get a large map, we need to download several smaller tiles and then combine them into one. We provide a script that automises the downloading of any area.
To run the script simply type in a terminal:
"name" is a base name for .osm files; "left", "right", "top" and "bottom" are boundaries of the requested area; "tiles" is a number of rows and columns that map will be divided to. In our tutorial we get 7x7 = 49 osm files (Luxembourg_osm.zip).
2. Convert OSM files to one NET file
We use NETCONVERT - a tool provided by SUMO to read a map representation from OSM (*.osm files) and convert it to a road network readable by SUMO (.net.xml file). Netconvert tool has many parameters that influence the conversion process
The netconvert parameters that worked for us the best are:
- --remove-edges.isolated
- --remove-edges.by-vclass rail_slow,rail_fast,bicycle,pedestrian
- --keep-edges.min-speed 12
- --ramps.guess
- --junctions.join
- --tls.join
- --no-internal-links
- --no-turnarounds
- --roundabouts.gues
You can modify our script and then run it in terminal:
"netconvertPath" specifies a path to the netconvert tool; "name" is a base name for .osm files as well as for .net.xml file; "tiles" is a number of rows/columns that .osm files are devided to.
Our Luxembourg.net.xml file contains the representation of road network over the area of 51km x 44km that contains 32302 edges (47917 lanes) and 15389 junctions. The produced network file can be open with SUMO as presented below:

3. Define your own attraction areas
Create a XML file with areas that are attractive in terms of residential, commercial or industrial purpose. A part of our Luxembourg.area.xml file is presented below:
The file should list circular areas described with their central point (x,y) and a radius. Each area has assigned a type (residential/commercial/industrial) and a probability. The sum of probabilities for every type should be less than or equal 1.
A root tag areas has attributes that specify how attractive are following types as destinations of trips. In the following example we see that the most trips will end in commercial areas (0.64).
Note!
The current version of VehiLux doesn't differentiate origins of trips. Trips start in randomly chosen residential areas, and only their destination is distributed over different types of areas according to given probabilities. This tutorial reflects the trend during morning hours, that means trips start at residential areas and finish mostly in commercial areas. More time-dependent model of probabilities distribution planned in the next versions of VehiLux that will allow to produce traces for 24-hour traffic.
4. Provide traffic volume counts
Create .loop.xml file with values of flows passing fixed counting sensors. In this tutorial we use Ponts et Chaussees traffic monitoring service in Luxembourg to obtain these values. We wrote scripts that download data from the server and generate XML file in the following format:
Each sensor "loop" has an id and a direction (every loop counts traffic in two directions) and an assigned edge, that indicates the edge in .net.xml file.
Our Luxembourg.loop.xml file contains 15 loops and each of them gives the average number of vehicles that passed a loop at hourly intervals presented as black squares on the picture below:
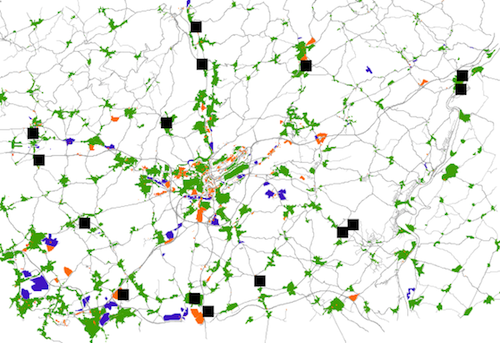
These traffic volume counts are used to generate traffic flows. For example, we generate the flow of 22 cars from the loop "1203" at the first hour of simulation. In addition to these paces, we generate a ratio of trips that start in randomly chosen residential areas. The trend obtained from traffic loops reflects the realistic behaviour of traffic flows during the day, and allow to reproduce it in our model.
5. Specify vehicle types
Create a file with vehicle types that will be randomly chosen for single trips. A structure of an example Luxembourg.veh.xml is shown below:
You may need a DTD file.
6. Generate traces
Get VehiLux2.0
Customise a configuration file:
Run java application RouteGeneration.java:
Note!
Dijkstra algorithm for large graphs requires a significant memory to run.
7. Play with SUMO
You should have get your traces generated to Luxembourg.rou.xml file. See more details in traces section.
You can run SUMO simulation with your traces. Just create a sumo configuration file or download a Scenario 1 package that presets traces generated with this tutorial. An example configuration file looks like following: